The Wood Buffalo Environmental Association (WBEA) monitors the air quality in the Regional Municipality of Wood Buffalo (RMWB) 24 hours a day, 365 days a year, through a network of 29 ambient air monitoring stations. Each station continuously measures concentrations of pollutants, along with meteorological parameters such as wind speed and direction, temperature, humidity, and atmospheric pressure.
Your nose is a very powerful detector! Human noses are able to identify and characterize odours much better than any machine or instrument. The WBEA was approached by local communities and First Nations to provide information about the odours they were experiencing on a regular basis, and how to deal with the issue. The Community Odour Monitoring Program (COMP) app was developed by the WBEA to provide the WBEA more information about local odours by enabling individuals to submit information about the odours they experience. These observations are used by to determine the sources of odours and improve our understanding of which pollutants cause odours in our region.
The COMP Annual Report is designed to show how your odour observations contribute to the overall understanding of odours in our region. The WBEA combines the information from your COMP submissions with our air quality data to answer three questions about odours in our community:
This is the sixth annual COMP report released by the WBEA. For more COMP information and previous years' reports,
click here.
Most odours that occur in ambient air (i.e., natural outdoor air) are caused by trace amounts of chemicals. The ability to smell a particular odour varies from person to person due to different sensitivities and the concentration of the pollutant. The way that odours are perceived also varies, for example, an odour which you may find pleasant may be offensive to your neighbour.
There are an immeasurable number of compounds in our atmosphere that cause odours. The WBEA collects data for specific compounds or groups of compounds that are known to cause odours and can be detected at low concentrations in the atmosphere. Below are the chemicals that the WBEA continuously monitors that are related to odours.
Total Reduced Sulphur (TRS) compounds are a large group of sulphur-containing compounds, including hydrogen sulphide (H2S), many of which are known to cause offensive odours. There are different types of compounds that are part of the TRS family; the more common compounds include sulphides, mercaptans, and thiophenes.
Sources: Anthropogenic sources include refineries, wastewater treatment facilities, and pulp & paper mills. TRS compounds may also be released through natural sources such as swamps and marshes.
Smell: Many TRS compounds can produce offensive odours at low concentrations, producing smells similar to rotten eggs or cabbage.

Hydrocarbons are a large group of compounds, which are either measured as total hydrocarbons (THC), or can be split into methane (a single carbon atom = C1) and non-methane hydrocarbons (the sum of all C2 to C12 hydrocarbon compounds). Methane itself does not have an odour – a smelly chemical is usually added to methane to allow you to smell it when you are using Natural Gas. Other hydrocarbons such as benzene, toluene, and xylene can be detected by humans at very low concentrations.
Sources: Anthropogenically, hydrocarbons are produced from fossil fuel production, livestock fermentation, landfills, and oil & gas burning systems. Hydrocarbons may also be released into the atmosphere through the biological processes in animals and vegetation.
Smell: Non-methane hydrocarbons (NMHC) may have odours at very low concentrations. Depending on the substance, they may smell like rotten cabbage, smelly socks, eggs, or may even smell sweet in some cases.

The WBEA monitors sulphur dioxide (SO2) because of sulphur emissions from the oil sands industry. Ambient concentrations of SO2 are very rarely high enough for people to detect, we instead use ambient air concentrations of SO2 to indicate the presence of industrial emissions. That industrial emission may contain other, more odorous compounds, which cause the odours people are experiencing. This can help distinguish the industrial odours from other local sources like construction, road work, and sewage plants.
Sources: SO2 is emitted when fuel containing sulphur is combusted. SO2 sources include emissions from petroleum extraction, petroleum refining facilities, and power plants. Volcanoes can also be a significant source of naturally occurring SO2.
Smell: SO2 is odourless at low concentrations, but is described as smelling like rotten eggs or a” just-struck match” when concentrations are high.

Source
Pollution is emitted into the air from a variety of sources.
Smell
The pollution may cause odours - anyone who experiences an odour in the RMWB can submit their observations via the WBEA’s COMP app.
Share
Users can learn about odours and view all observations submitted at comp.wbea.org.

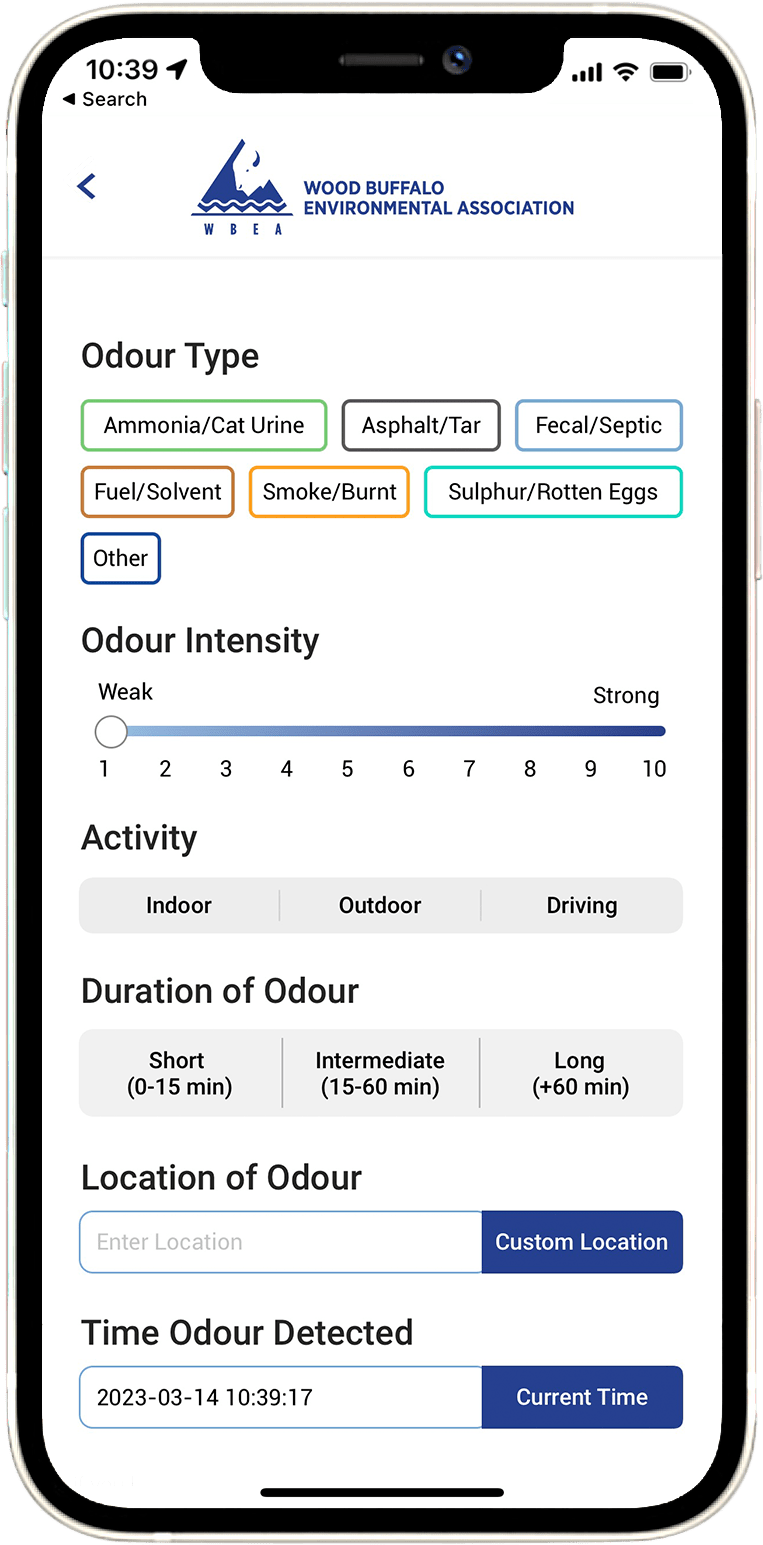
*Not all fields are shown
Below are descriptions of the information collected through the COMP App and used by the WBEA to improve our understanding of odours in the RMWB! All details submitted through the app are anonymous.
The type of odour can be described once the concentration is high enough to be detected by the human nose. The odour type is subjective, and users can select the odour type that best describes the odour that they are experiencing. There are currently seven options within the COMP App:
The intensity of an odour is the perceived strength that is being experienced by the individual and is not necessarily related to its concentration. For example, a particularly pungent odour at a low concentration may be perceived to be more intense than a less pungent substance at a higher concentration. The intensity may also depend on the individual’s perception of that odour; an odour that is offensive to someone may be perceived as more intense than one that is pleasant.
Users can provide information about what they are doing when they encounter the odour; they can indicate whether they are indoors, outdoors, or driving.
Duration of odour is the length of time which the user experiences the odour. The duration of the odour can impact how it is perceived; an odour which had a very long duration may be perceived as more offensive than one that was encountered only briefly. Duration can be categorized as short (0-15 min), intermediate (15-60 min) or long (+60 min).
The COMP app allows users to either submit their current location or specify the location where they experienced the odour. The WBEA collects the location where the user experienced the odour so we examine the data at the nearest ambient air monitoring station. It is also used to compare multiple observations to each other when they are submitted from the same area.
The WBEA uses the odour detection times to know when the odour event occurred. Multiple odour observations that are submitted in the same time period can indicate a significant odour event.
Odour units are a standardized method to quantify the strength of an odour. These values should only be entered if you have a device that allows you to report them accurately. This is an optional field within the COMP App.
If an odour is particularly strong and a user wants to file a report with the Alberta Government, they can call their 24-hour Energy & Environmental Response line, whose number is listed on the main page of the App. When a user files a report, they will be provided with a Reference Number. The user can enter that Reference Number into the App. This is an optional field within the COMP App.
There was a decrease in odour observations in 2023 compared to previous years, recording a total of 60 observations. This decline in observations may be due to a variety of different factors including:
Total odour observations
Odour event days occur when a specific number of observations are reached from a community in one day. Event days are used to trigger a more in-depth investigation of the air quality for that day; the WBEA will look at wind patterns, pollutant concentrations throughout the day, and conditions at nearby air monitoring stations to determine what may have caused the odour.
The number of observations required to trigger an event day varies by community; the triggers were changed for the 2023 report due to the decreased number of odour observations. An odour event day in Fort McMurray is when two or more observations were submitted on the same day from two or more unique users. Event days for Fort McKay, Anzac, Janvier, and Conklin are when one odour observation is made on that day.
The figures in this section highlight the details of the odour events including: location of the observations, the wind profile for the day, and the concentrations of various odour causing air pollutants during the day.
To gain a better understanding of the odours, the WBEA examines different atmospheric parameters, these include:
There were 11 odour event days in 2023. Click on each date to see more details about the event including: an explanation about the odour event, a graph showing the concentration of pollutants on that day, a wind rose showing the wind patterns, and a map of where the observations took place!
On January 21, one observation was made by a user in the afternoon at 15:30. The observation was made just south of the community while the user was outdoors, and described the odour as a fuel-like smell that lasted for a long time.
The nearest air monitoring station was the Bertha Ganter station, located less than one kilometer away from the user at the time of submission. The monitoring station recorded significantly elevated SO2, TRS, and NMHC for a large portion of the day, between 06:00 – 18:00, peaking at approximately 15:00. Wind patterns throughout the period of elevated air pollutants remained consistent, with moderate wind speeds coming from the South-Southeast direction.
Ambient air data suggests that there were likely significant industrial contributions affecting the odours in the community throughout the day from oil sands operations to the South of the community. The User submitted their observation near the time when pollutant concentrations were at their highest concentration, likely when odours were strongest.
The wind rose shows the direction, speed, and frequency of winds at a specific location. The position of the triangles indicate the direction the wind is coming from, the colours within the triangles show the different speeds of the wind, and the size of the triangles shows the number of hours from which the wind was travelling from that direction.
Wind Speed (km/hour)
On January 25, two observations were made by two unique users in Fort McMurray. The observations were made from outdoor locations in downtown Fort McMurray, they were described as fuel (1), and smoke (1). One observation was made in the morning at 09:00, and one in the evening at 19:30.
There are two air monitoring stations in Fort McMurray: Patricia McInnes and Athabasca Valley. Both sites experienced elevated concentrations of SO2 and TRS throughout the morning and early afternoon. Winds were blowing at light-to-moderate speeds from the North during the morning, and from the Southeast in the afternoon.
The elevated SO2 concentrations and winds blowing in from the North in the morning suggest that industrial operations to the North of the city were the cause of ‘fuel’ odours early in the day.
The wind rose shows the direction, speed, and frequency of winds at a specific location. The position of the triangles indicate the direction the wind is coming from, the colours within the triangles show the different speeds of the wind, and the size of the triangles shows the number of hours from which the wind was travelling from that direction.
Wind Speed (km/hour)
On February 8, one observation was made near the community of Anzac. The observation was made on the Southwest side of Gregoire Lake, just outside of the town of Anzac. The odour was reported in the morning, around 10:00 and was characterized as sulphur with a medium strength odour intensity.
The Anzac air monitoring station reported elevated levels of SO2 and TRS between 03:00 to 13:00, with a spike in NMHC between 12:00 – 13:00. The wind was blowing from the West in the early morning, changing to blow from the Southeast at approximately 08:00, just before the odour observation was submitted.
The elevated SO2 concentration throughout the morning suggests that industrial operations were the likely cause of the odour, from a facility Southeast of the community.
The wind rose shows the direction, speed, and frequency of winds at a specific location. The position of the triangles indicate the direction the wind is coming from, the colours within the triangles show the different speeds of the wind, and the size of the triangles shows the number of hours from which the wind was travelling from that direction.
Wind Speed (km/hour)
On March 25, three observations were made by two unique users in Fort McMurray. The observations were both made from the Northern side of Fort McMurray, the odours were described as sulphur (1), and asphalt (2). The observations were made in the morning between 10:00 – 12:00.
There are two air monitoring stations in Fort McMurray: Patricia McInnes and Athabasca Valley. Both stations experienced a sharp increase in SO2, TRS, and NMHC concentration between 09:00 – 13:00. Wind patterns also shifted at 09:00, changing direction to blowing from the North and increasing wind speed.
Conclusion: The elevated SO2 suggests that industrial operations were likely the source of the incoming NMHC and TRS concentrations during this event. The shift in wind speed that coincides with elevated pollutant concentrations indicate that the source of the odours were industrial facilities to the North of the community.
The wind rose shows the direction, speed, and frequency of winds at a specific location. The position of the triangles indicate the direction the wind is coming from, the colours within the triangles show the different speeds of the wind, and the size of the triangles shows the number of hours from which the wind was travelling from that direction.
Wind Speed (km/hour)
On May 18, one observation was made by a user in the evening at 22:30. The observation was made just south of the community on the road while driving; it described the odour as a strong asphalt-like smell.
The nearest air monitoring station was the Fort McKay South station, located just over one kilometer away from the user at the time of submission. The monitoring station picked up intermittent elevated SO2 concentrations earlier in the day at 07:00 and 15:00, however there were no elevated SO2, TRS, or NMHC readings at the time of the odour observation. Winds were calm and blowing from the Southwest at the time of the observation.
Ambient air data suggests there may have been odours caused by industrial operations earlier in the day, but not at the time of the observation. Localized construction or burning operations can be a source of odours that may not be picked up by nearby ambient air monitoring stations.
The wind rose shows the direction, speed, and frequency of winds at a specific location. The position of the triangles indicate the direction the wind is coming from, the colours within the triangles show the different speeds of the wind, and the size of the triangles shows the number of hours from which the wind was travelling from that direction.
Wind Speed (km/hour)
On June 24, one observation was made by a user in the morning at approximately 08:30. The observation was made within the community while the user was indoors; the odour was described as a strong asphalt-like smell that had a long duration.
The nearest air monitoring station was the Waskōw ohci Pimâtisiwin station, located less than one kilometer from the location of the odour observation. The monitoring station observed elevated SO2, TRS, and NMHC concentrations from 06:00 – 10:00 that morning. Winds were blowing at light to intermediate speeds and shifted in direction from the Southwest to the Southeast at the same time as the pollutant concentration increases.
Elevated SO2 in the morning suggests that odours from the nearby industrial facilities contributed to the odour that occurred in the morning. Increasing TRS and NMHC concentrations coinciding with the change in wind direction coming from the Southeast suggest that the odourous compounds originated from an industrial facility to the Southeast of the community.
The wind rose shows the direction, speed, and frequency of winds at a specific location. The position of the triangles indicate the direction the wind is coming from, the colours within the triangles show the different speeds of the wind, and the size of the triangles shows the number of hours from which the wind was travelling from that direction.
Wind Speed (km/hour)
On July 18, two observations were made by two unique users in Fort McMurray. The observations were both made from the Northern side of Fort McMurray, both odour observations were described as high intensity, long duration, and characterized the smell as other (2). The observations were made in the morning the first at 07:00 and the second at 09:00.
The Patricia McInnes air monitoring station was the closest to the two observations and was located 3 – 5 kilometers from away. The monitoring station observed elevated TRS and SO2 concentrations in the morning and the previous day’s evening. The SO2 concentration increased less dramatically than the TRS, only elevating to roughly 1 ppb. The wind patterns stayed constant for most of the morning, blowing at moderate speed from the North.
The elevated TRS concentration throughout the morning and previous evening was likely the cause of the odours. The elevated SO2 and winds blowing from the North suggest that they likely originate from an industrial source to the North of the community.
The wind rose shows the direction, speed, and frequency of winds at a specific location. The position of the triangles indicate the direction the wind is coming from, the colours within the triangles show the different speeds of the wind, and the size of the triangles shows the number of hours from which the wind was travelling from that direction.
Wind Speed (km/hour)
On July 25, one observation was made by a user in the evening at 18:30. The observation was made within the community while the person was indoors. The odour was described as an intermediate strength sulphur-like smell that had a long duration.
The nearest air monitoring station was the Waskōw ohci Pimâtisiwin station, located less than one kilometer from the location of the odour observation. The station reported elevated NMHC concentrations between 16:00 – 19:00, around the same time that the odour observation occurred. Wind patterns did not significantly shift at the time of the observation, remaining constant with low wind speeds and blowing from the North between 11:00 – 19:00.
There was no significant elevation of any SO2, suggesting that the odours were likely not from oil sands activities. The source of the odour may have been a result of a localized event such as construction, waste treatment, or burning activities.
The wind rose shows the direction, speed, and frequency of winds at a specific location. The position of the triangles indicate the direction the wind is coming from, the colours within the triangles show the different speeds of the wind, and the size of the triangles shows the number of hours from which the wind was travelling from that direction.
Wind Speed (km/hour)
On September 3, one observation was made near the community of Anzac. The observation was made near Long Lake, roughly 4 km East of the community. The odour was reported in the early morning, around 02:00 and was characterized as a moderate intensity smoke odour with a long duration.
The Anzac air monitoring station did not report elevated levels of SO2, TRS, or NMHC, however did indicate extremely elevated levels of fine particulate matter (PM2.5). The wind patterns remained consistent throughout the day with low wind speeds blowing from the Southwest.
The elevated PM2.5 concentration throughout the day was due to regional wildfire smoke that was very prevalent over the 2023 summer.
The wind rose shows the direction, speed, and frequency of winds at a specific location. The position of the triangles indicate the direction the wind is coming from, the colours within the triangles show the different speeds of the wind, and the size of the triangles shows the number of hours from which the wind was travelling from that direction.
Wind Speed (km/hour)
On October 15, one observation was made near the community of Anzac. The observation was made near Gregoire Lake Provincial Park, roughly 10 km west of the Anzac community. The odour was reported in the morning, around 10:30 and was characterized as a high intensity ammonia odour with an intermediate duration.
The Anzac air monitoring station reported elevated levels of SO2 between 10:00 and 13:00, around the same time that the odour observation was made. There was no observed increase in TRS or NMHC concentrations throughout the day. Ammonia is not monitored at the Anzac air monitoring station, making it unclear which compounds caused the odour. The wind was blowing throughout the morning at moderate speeds from the East.
The elevated SO2 concentration throughout the morning suggests that industrial operations were the likely cause of the odour, from a facility East of the community. It is unclear what type of compounds were present in the atmosphere that caused the odours during this event.
The wind rose shows the direction, speed, and frequency of winds at a specific location. The position of the triangles indicate the direction the wind is coming from, the colours within the triangles show the different speeds of the wind, and the size of the triangles shows the number of hours from which the wind was travelling from that direction.
Wind Speed (km/hour)
On October 17, four observations were made by four unique users in Fort McMurray. The observations were all made from the Northern side of Fort McMurray, described as ammonia (1), asphalt (2), and other(1). The observations were made throughout the day, at 07:00, 07:30, 10:30, and 16:30.
There are two monitoring stations in Fort McMurray, Athabasca Valley and Patricia McInnes, and both locations reported elevated air pollutant concentrations throughout the day. TRS and NMHC concentrations peaked in the morning between 06:00 – 11:00, and SO2 reached its highest concentration in the afternoon at 16:00. Wind patterns throughout the day remained consistent with moderate speeds blowing in from the North until 23:00.
Elevated SO2 concentrations and winds from the North throughout the day suggest that the source of the odours are industrial operations to the North of the community. Both TRS and NMHC were elevated in the morning when three of the odour observations came through, indicating that the odours were likely caused by both hydrocarbon and sulphur compounds.
The wind rose shows the direction, speed, and frequency of winds at a specific location. The position of the triangles indicate the direction the wind is coming from, the colours within the triangles show the different speeds of the wind, and the size of the triangles shows the number of hours from which the wind was travelling from that direction.
Wind Speed (km/hour)

This section examines odour observations based on the community nearest to where the odour was detected. This information can be used to find trends in specific areas. The community breakdown includes a map of odour observations and types, a graph showing pollutant concentrations, and a wind rose explaining wind patterns during observations. If a community is missing from the list, it is because no odour observations were submitted in 2023 from that location.
The largest community in the RMWB, Fort McMurray experiences odours from many different sources. Local odours in Fort McMurray may come from industry sites, the wastewater treatment facility, or residential uses such as vehicle exhaust and generator use. Regional sources may include industrial mining and refining operations located directly North of Fort McMurray and nearby wildfires.
Ammonia
Asphalt
Fecal
Fuel
Smoke
Sulphur
Other
The histogram below shows the difference in odour compound concentrations during COMP observations and background concentrations. The higher concentrations during COMP observations suggest that people are good at detecting these pollutants!
The wind rose below shows the wind patterns during COMP observations, it shows what directions the winds most commonly come from during odour observations.
The wind rose shows the direction, speed, and frequency of winds during odour observations made in 2023 at this community. The position of the triangles indicate the direction the wind is coming from, the colours within the triangles show the different speeds of the wind, and the size of the triangles shows the number of hours from which the wind was travelling from that direction.
Wind Speed (km/hour)
Fort McKay is a relatively small community of less than 1000 people located in the heart of the major oil sands industrial sites. Local odours in Fort McKay may come from vehicles, construction projects, and other wood or fuel burning uses. External odour sources may come from the industrial mining operations located directly North and South of the community, as well as wildfires.
Asphalt
Fuel
Sulphur
The histogram below shows the difference in odour compound concentrations during COMP observations and background concentrations. The higher concentrations during COMP observations suggest that people are good at detecting these pollutants!
The wind rose below shows the wind patterns during COMP observations, it shows what directions the winds most commonly come from during odour observations.
The wind rose shows the direction, speed, and frequency of winds during odour observations made in 2023 at this community. The position of the triangles indicate the direction the wind is coming from, the colours within the triangles show the different speeds of the wind, and the size of the triangles shows the number of hours from which the wind was travelling from that direction.
Wind Speed (km/hour)
The Anzac location includes the hamlet of Anzac as well as the other communities around Gregoire Lake including Gregoire Lake Estates and Cheecham. Anzac is located roughly 30 kilometers south of Fort McMurray. Local odour sources in Anzac include vehicle emissions, construction projects, and wastewater treatment. External odours include the industrial SAGD facilities to the South & Southeast, oil sands mines to the North, and nearby wildfires.
Ammonia
Smoke
Sulphur
The histogram below shows the difference in odour compound concentrations during COMP observations and background concentrations. The higher concentrations during COMP observations suggest that people are good at detecting these pollutants!
The wind rose below shows the wind patterns during COMP observations, it shows what directions the winds most commonly come from during odour observations.
Wind Rose
The wind rose shows the direction, speed, and frequency of winds during odour observations made in 2023 at this community. The position of the triangles indicate the direction the wind is coming from, the colours within the triangles show the different speeds of the wind, and the size of the triangles shows the number of hours from which the wind was travelling from that direction.
Wind Speed (km/hour)
The following graphs provide a summary of all odour event parameters submitted to the COMP app by users in 2023.
This map allows you to see where all the odour observations from the COMP program have been made since it’s inception. You can also adjust your view to only show where observations of specific odour types are made. Click on the Details tab on the left side of the map for instructions.

Total odour observations
Sept 2017 to Dec 2023 1,49954%
of odour observations were classified as long
(>60 min)
52%
of odour strengths were reported as
≥8 out of 10
Highest number of observations occurring
in June through October
The Community Odour Monitoring Program is still going on. To participate and provide information on the odours you experience in the Regional Municipality of Wood Buffalo:
The information collected is anonymous and will be used for research purposes only.
The Wood Buffalo Environmental Association is a partner of Alberta Environment and Protected Areas.
The WBEA would also like to acknowledge that this work was funded under the Oil Sands Monitoring (OSM) Program. It is independent of any position of the OSM Program.