The Wood Buffalo Environmental Association (WBEA) monitors the air quality in the Regional Municipality of Wood Buffalo (RMWB) 24 hours a day, 365 days a year, through a network of 29 ambient air monitoring stations. Each station continuously measures concentrations of pollutants, along with meteorological parameters such as wind speed and direction, temperature, humidity, and atmospheric pressure.
The WBEA was repeatedly approached by community partners about the odour events they had experienced. Currently, analyzers can measure the concentration of specific pollutants or groups of pollutants but cannot detect the presence or intensity of an odour.
Your nose is a very powerful detector! Human noses are able to identify and characterize odours much better than any machine or instrument. The odour observations that you submit allow the WBEA to determine the sources of odours and improve our understanding of which pollutants cause odours in our region.
The Community Odour Monitoring Program (COMP) App was developed by the WBEA to enable individuals to submit information about the odours they experience. The App allows the WBEA to connect that information to the ambient air data collected at WBEA air monitoring stations.
This is the fifth annual COMP report released by the WBEA; additional information and reports from previous years can be found here.

The ability to smell a particular odour varies from person to person due to different sensitivities and depends on the concentration of the pollutant. Odours can also be perceived differently, an odour which you may find pleasant may be offensive to your neighbour.
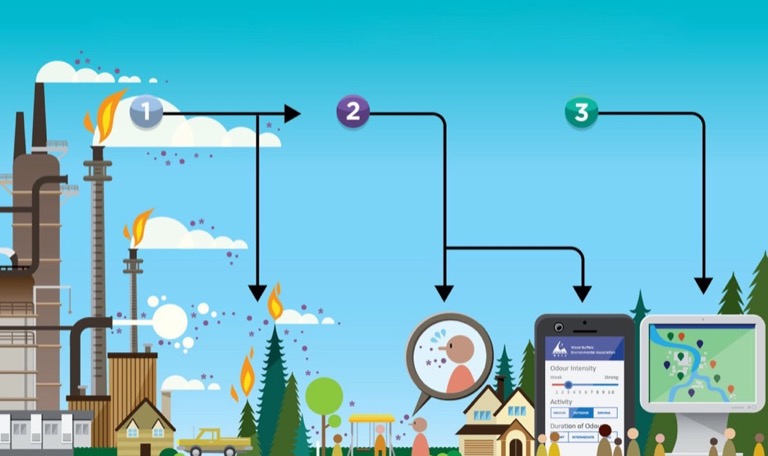
Pollution is emitted into the air from a variety of sources.
The pollution may cause odours - anyone who experiences an odour in the RMWB can submit their observations via the WBEA’s COMP app.
Users can learn about odours and view all observations submitted at comp.wbea.org.
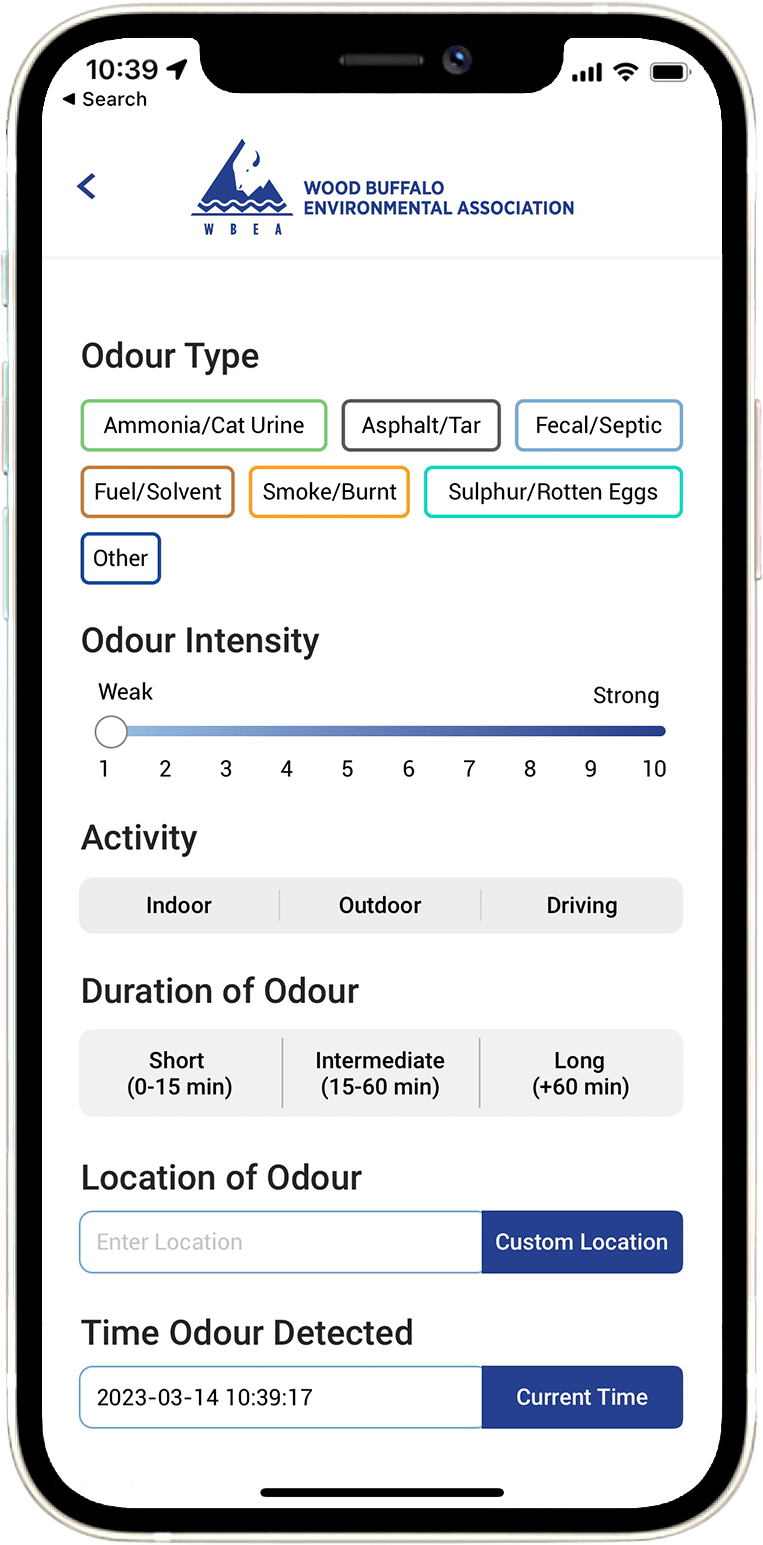
Below are descriptions of the information collected through the app and subsequently used by the WBEA to improve our understanding of odours in the Wood Buffalo region! All details submitted through the app are anonymous.
*Not all fields are shown
The odour type is completely subjective based on the person, and within the COMP App there are currently seven options: Ammonia/Cat Urine, Asphalt/Tar, Fecal/Septic, Fuel/Solvent, Smoke/Burnt, Sulphur/Rotten Eggs, and Other. Users can select the odour type that best describes the odour they are experiencing.
The intensity of an odour is the perceived strength that is being experienced by the individual and is not necessarily related to its concentration. For example, a particularly pungent odour at a low concentration may be perceived to be more intense than a less pungent substance at a higher concentration. The intensity may also depend on the individual’s perception of that odour.
Users can provide information about what they are doing when they encounter the odour; they can indicate whether they are indoors, outdoors, or driving.
Duration of odour is the length of time which the user experiences the odour. The duration of the odour can impact how it is perceived; an odour which had a very long duration may be perceived as more offensive than one that was encountered only briefly.
It is necessary to collect the location where the user experienced the odour so that the WBEA can examine the data at the nearest ambient air monitoring station. It is also used to compare multiple observations to each other when they are submitted from the same area.
The WBEA uses the odour detection times to know when the odour event occurred. Multiple odour observations that are submitted in the same time period can indicate a significant odour event.
Odour units quantify the strength of an odour; these values should only be entered if you have an instrument that allows you to report them accurately. This is an optional field within the COMP App.
If an odour is particularly strong and a user wants to file a report with the Alberta Government, they can call their 24-hour Energy & Environmental Response Line, whose number is listed on the main page of the App. When a user files a report, they will be provided with a Reference Number. The user can enter that Reference Number into the App. This is an optional field within the COMP App.
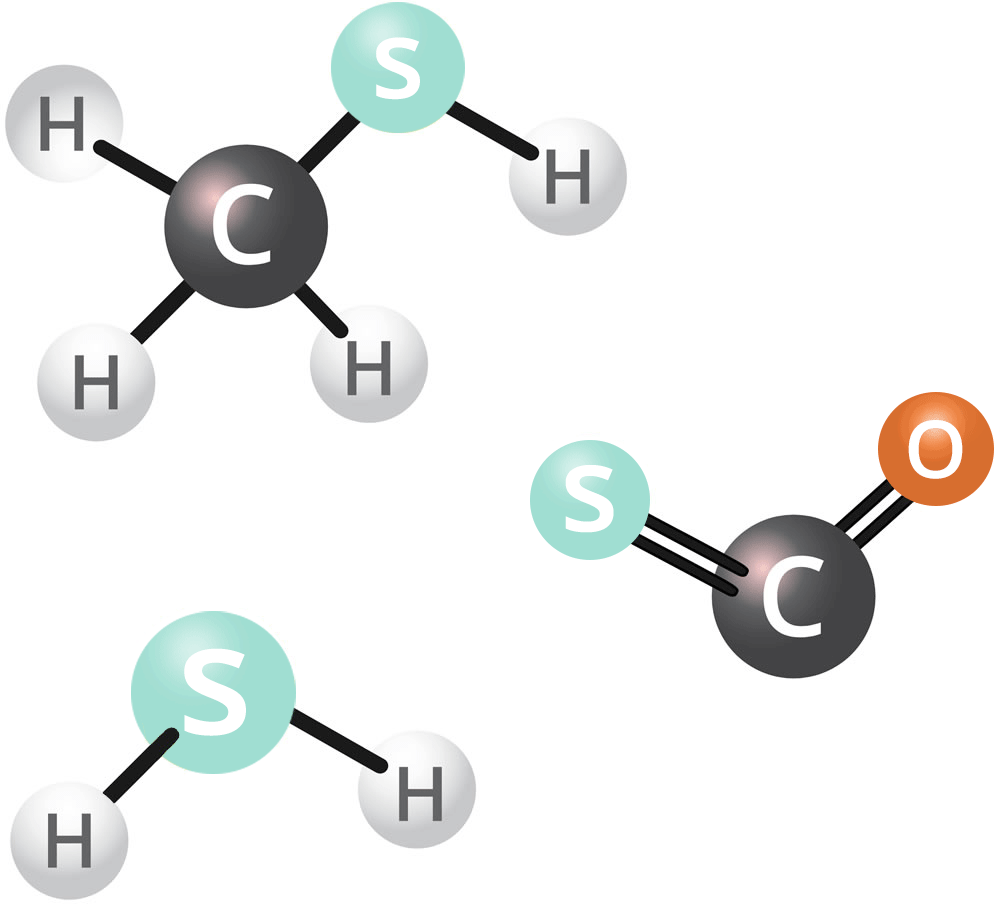
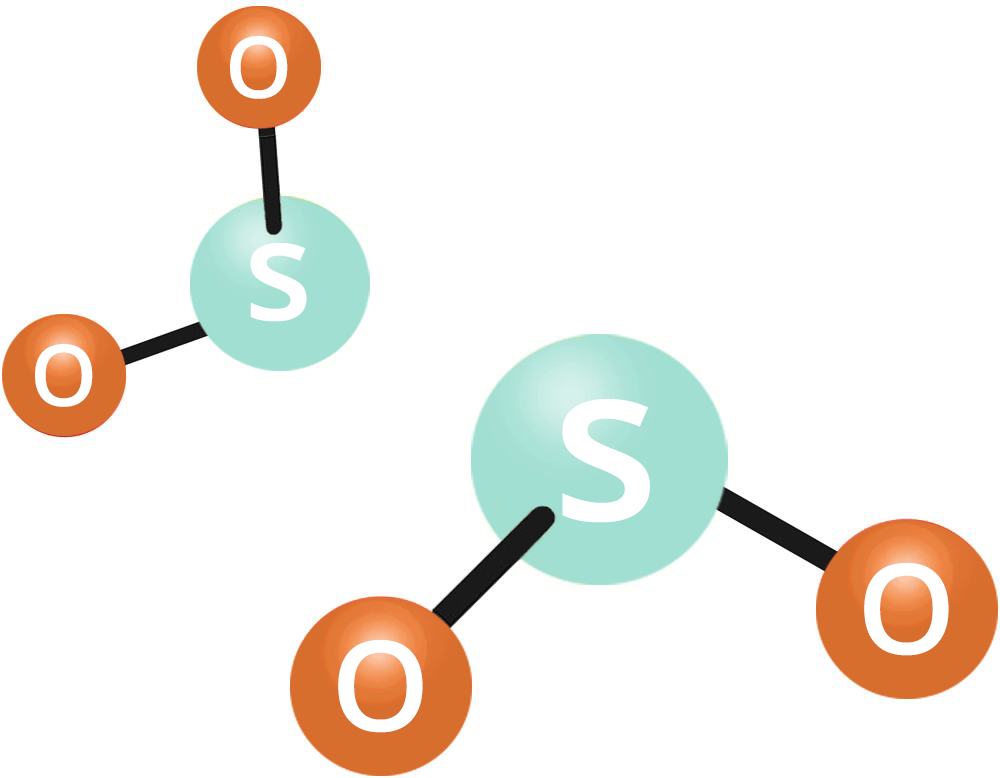
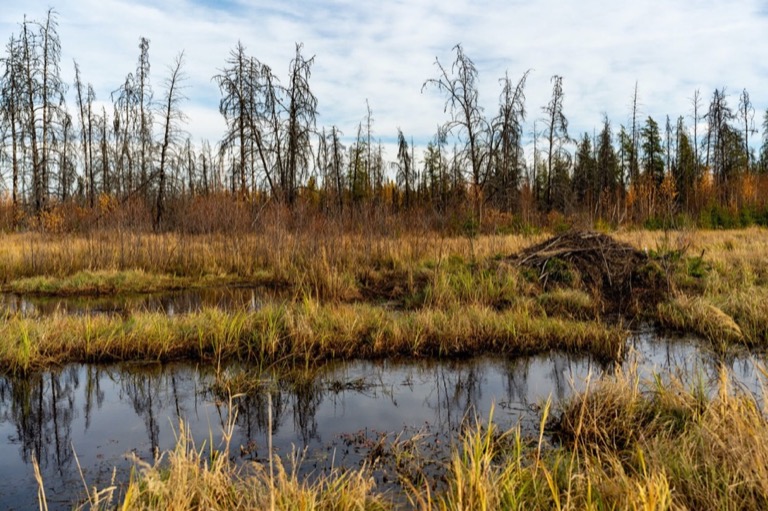
Total Reduced Sulphur (TRS) compounds are a large group of sulphur-containing compounds, many of which are known to cause offensive odours. There are different types of compounds that are part of the TRS family, the more common compounds include hydrogen sulphide (H2S) sulphides, mercaptans, and thiophenes. There are many sources of TRS compounds, anthropogenic sources include refineries, wastewater treatment facilities, and pulp & paper mills. TRS compounds may also be released into the atmosphere through natural sources such as swamps and marshes. Many TRS compounds can produce offensive odours at low concentrations, producing smells similar to rotten eggs or cabbage.
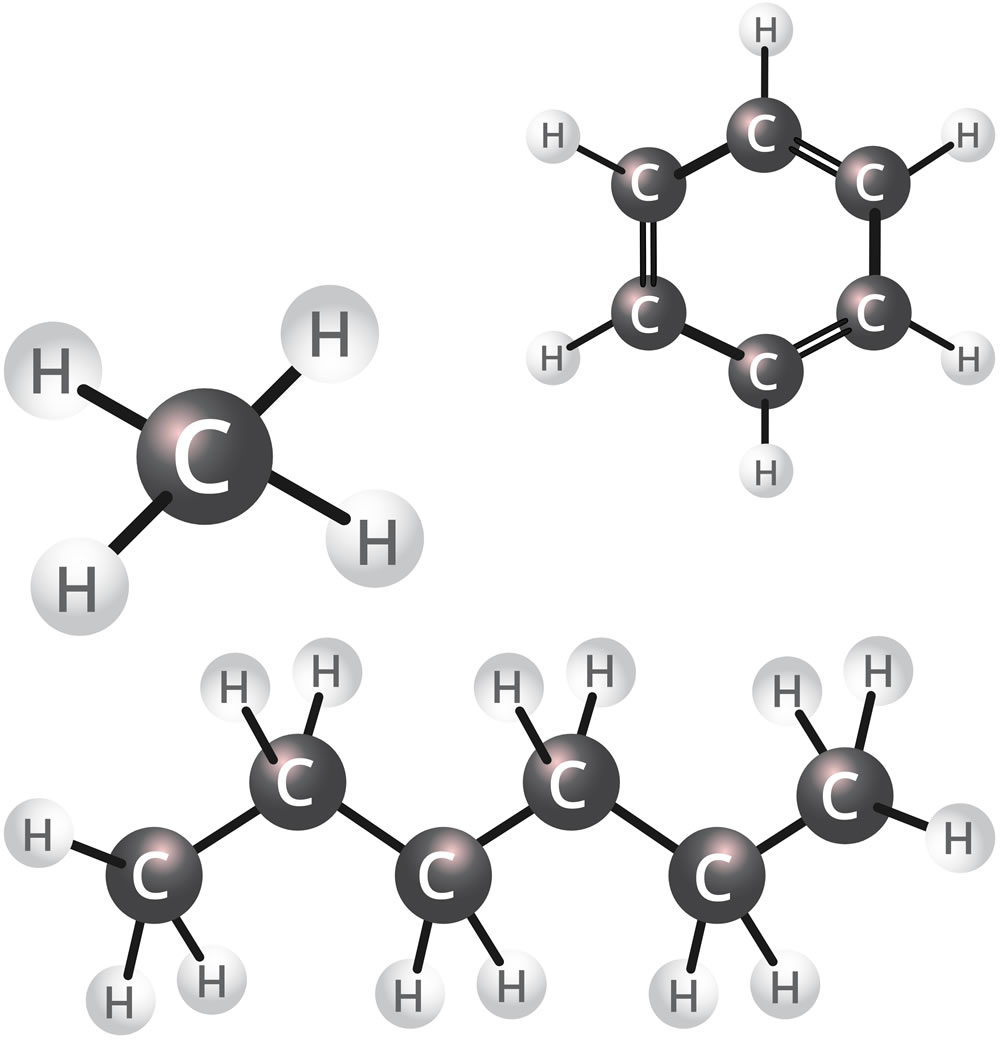
Hydrocarbons are a large group of compounds, which are either measured as total hydrocarbons (THC), or due to new monitoring technology, can be split into methane (a single carbon atom = C1) and non-methane hydrocarbons (the sum of all C2 to C12 hydrocarbon compounds). Methane itself does not have an odour – a smelly chemical is usually added to methane to allow you to smell it when you are using Natural Gas. Methane from industrial combustion does not have the additive, so will not have an odour. Methane is also present naturally in the air, at a concentration of about 1.8 parts per million (ppm).
Non-methane hydrocarbons (NMHC) may have odours at very low concentrations. Depending on the substance, they may smell like rotten cabbage, smelly socks, or eggs.
The WBEA monitors sulphur dioxide (SO2) because of sulphur emissions from the oil sands industry. SO2 is emitted when fuel containing sulphur is combusted. Ambient concentrations of SO2 are generally not high enough for people to detect. We use ambient air concentrations of SO2 to indicate the potential presence of an industrial emission. That industrial emission may contain other, more odorous compounds, which cause the odours people are experiencing. This can help distinguish the industrial odours from other local sources like construction, road work, and sewage plants.

To get a better understanding of the source of the odours, the WBEA looks at different pollutants in the atmosphere, these include:
The number of observations required to consider any given date as an “odour event day” varies by community sizes within the RMWB and their proximity to industry operations.
For example, an odour event day in Fort McMurray, which is the largest community within the region, was defined as when four or more unique user observations were submitted on the same day. An odour event day in Fort McKay was determined to be when two or more unique user observations were noted on the same day. An odour event for Anzac, Janvier, Conklin or Fort Chipewyan were documented when there was at least one odour observation submission. These definitions were also used for 2022 observations.
The graphs in this section highlight odour events plotted with daily average concentrations of compounds for each event day.
To get a better understanding of the source of the odours, the WBEA looks at different pollutants in the atmosphere, these include:
In 2022, a total of six days met these criteria
Since counting Odour Event Days through the COMP Program relies on individuals reporting through the App, the Odour Event Days reported here likely do not represent the actual number of odour event days in each community and may under represent odours experienced by the public.
On January 13, four observations were made by four unique users in Fort McMurray. The observations were made from outdoor locations throughout Fort McMurray, they were described as ammonia (2), fuel (1), and asphalt (1). One observation was made in the morning in the 8:00 hour, one in the afternoon in the 13:00 hour, and two were made in the evening in the 18:00 and 19:00 hours.
There are two air monitoring stations in Fort McMurray: Patricia McInnes and Athabasca Valley. Both sites experienced elevated concentrations of SO2, TRS, and NMHC throughout the day. Winds were blowing at light-to-moderate speeds from the Northwest (NW) and North-Northwest (NNW).
See below for additional information about each event day, including daily concentrations of odour observations, wind roses, and maps.
Elevated SO2 concentrations at times of odour observations and were likely an indicator of an industrial plume(s). The observations coincided with wind direction from the north.
This wind rose shows the direction, speed, and frequency of winds at the Athabasca Valley and Patricia McInnes Air Monitoring stations on January 13th, 2022. The triangles indicate the direction the wind is coming from, the colours within the triangles show the different speeds of the wind, and the size of the bars within the triangles shows the number of hours the wind was travelling from that direction and that speed.
Wind Speed (km/hour)
On January 20, one observation was made near the community of Anzac. The observation was made approximately 10km to the west of the Anzac air monitoring station. The odour was reported in the evening around 22:00 and was characterized as smoke with a very strong odour intensity.
The Anzac air monitoring station did not report elevated levels of TRS or NMHC but did see SO2 concentration spike 1 hour after the observation was reported. The wind was blowing at a relatively high speed of 24 km/hr from the Northwest at the time of observation.
See below for additional information about each event day, including daily concentrations of odour observations, wind roses, and maps.
Elevated SO2 concentrations at times of odour observations and were likely an indicator of an industrial plume(s). The observations coincided with wind direction from the northwest.
This wind rose shows the direction, speed, and frequency of winds at the Anzac Community Air Monitoring station on January 20th, 2022. The triangles indicate the direction the wind is coming from, the colours within the triangles show the different speeds of the wind, and the size of the bars within the triangles shows the number of hours the wind was travelling from that direction and that speed.
Wind Speed (km/hour)
On January 30, ten observations were made by eight unique users in Fort McMurray. The observations were made at several locations across Fort McMurray, the odours were described as ammonia (3), asphalt (2), fuel (1), fecal (1), sulphur (1), and other (2). The observations were made throughout the day, ranging from 05:00 – 14:00; however, a cluster of seven observations occurred in the morning between 07:00 and 10:00.
There are two air monitoring stations in Fort McMurray: Patricia McInnes and Athabasca Valley. Both stations reported elevated TRS, NMHC, and SO2 in the morning, near the time of the odour observations. The wind direction at the time of the observations was primarily from the Northwest, and the speed was between 9 – 13 km/hr throughout the day. The observations primarily align with the elevated TRS and NMHC concentrations, suggesting that they were the primary causes of the odour.
See below for additional information about each event day, including daily concentrations of odour observations, wind roses, and maps.
Elevated SO2, TRS, and NMHC concentrations at times of odour observations and were likely an indicator of an industrial plume(s). The observations coincided with wind direction from the northwest.
This wind rose shows the direction, speed, and frequency of winds at the Athabasca Valley and Patricia McInnes Air Monitoring stations on January 30th, 2022. The triangles indicate the direction the wind is coming from, the colours within the triangles show the different speeds of the wind, and the size of the bars within the triangles shows the number of hours the wind was travelling from that direction and that speed.
Wind Speed (km/hour)
On August 3, two observations were made by two unique users in Fort McKay. Another observation was made on August 3 on the highway between Fort McMurray and Fort McKay, approximately 40 km south of the community. The two observations were made within the community of Fort McKay between 10:00 and 12:00, and were both characterized as smoke.
Our Bertha Ganter – Fort McKay Monitoring Station experienced significantly elevated levels of TRS, NMHC, and SO2 in the morning and early afternoon, near the times of the odour observations. The wind at the time of the observations was blowing from the Southeast and travelling at a speed of 5 – 6 km/hr.
See below for additional information about each event day, including daily concentrations of odour observations, wind roses, and maps.
Elevated SO2, TRS, and NMHC concentrations at times of odour observations and were likely an indicator of an industrial plume(s). The observations coincided with wind direction from the southeast.
This wind rose shows the direction, speed, and frequency of winds at the Bertha Ganter-Fort McKay Air Monitoring station on August 3rd, 2022. The triangles indicate the direction the wind is coming from, the colours within the triangles show the different speeds of the wind, and the size of the bars within the triangles shows the number of hours the wind was travelling from that direction and that speed.
Wind Speed (km/hour)
On August 16, two observations were made by one unique user in Fort McKay. The two observations were made at different locations within the Fort McKay community in the 09:00 and 14:00 hours. The odour was characterized as asphalt for both.
Our Bertha Ganter – Fort McKay Monitoring Station recorded elevated TRS concentrations throughout the day, and experienced spikes of NMHC and SO2 concentrations at approximately 09:00 and 17:00. The wind profile for August 16 was primarily blowing from the Southeast, with relatively calm wind speeds ranging from 5 – 8 km/hr.
See below for additional information about each event day, including daily concentrations of odour observations, wind roses, and maps.
Elevated SO2, TRS, and NMHC concentrations at times of odour observations and were likely an indicator of an industrial plume(s). The observations coincided with wind direction from the southeast.
This wind rose shows the direction, speed, and frequency of winds at the Bertha Ganter-Fort McKay Air Monitoring station on August 16th, 2022. The triangles indicate the direction the wind is coming from, the colours within the triangles show the different speeds of the wind, and the size of the bars within the triangles shows the number of hours the wind was travelling from that direction and that speed.
Wind Speed (km/hour)
On August 26, two odour observations were made by two unique users in Fort McKay. The observations were made in in the 10:00 and 15:00 hours at two different locations near the North end of the community. Both odour observations were characterized as ‘asphalt’.
Bertha Ganter - Fort McKay recorded elevated SO2, H2S, TRS, and NMHC concentrations beginning in the morning and early afternoon; The wind profile for the time period was blowing from the South with wind speeds up to 10 km/hr.
See below for additional information about each event day, including daily concentrations of odour observations, wind roses, and maps.
Elevated SO2 , TRS, and NMHC concentrations at times of odour observations and were likely an indicator of an industrial plume(s). The observations coincided with wind direction from the south.
This wind rose shows the direction, speed, and frequency of winds at the Bertha Ganter-Fort McKay Air Monitoring station on August 26th, 2022. The triangles indicate the direction the wind is coming from, the colours within the triangles show the different speeds of the wind, and the size of the bars within the triangles shows the number of hours the wind was travelling from that direction and that speed.
Wind Speed (km/hour)

This section examines odour observations based on data from the nearest community air monitoring station. If a community is missing from the list, it is because no odour observations were submitted in 2022 from that location. Odour concentrations are displayed both as histograms and pollution roses.
Smoke
Data in the following section is presented using histograms. Concentration ranges are shown in correlation to the number of odour observations that were submitted.
Note: Local NMHC levels were 0.0 PPM at the time of observation.
The above histograms show the distribution of different air quality concentrations and meteorological parameters. This is not representative of the whole year; it only shows the conditions when odour observations were submitted.
The pollution rose shows the pollutant concentration and wind direction at each community station when odour observations were submitted, between January 2022 and December 2022. The triangles indicate the direction the wind is coming from, the colours within the triangles show the different concentrations of the pollutant, and the size of the bars within the triangles shows the number of hours the pollutant concentration was associated with that wind direction.
SO2 (ppb)
The pollution rose shows the pollutant concentration and wind direction at each community station when odour observations were submitted, between January 2022 and December 2022. The triangles indicate the direction the wind is coming from, the colours within the triangles show the different concentrations of the pollutant, and the size of the bars within the triangles shows the number of hours the pollutant concentration was associated with that wind direction.
TRS (ppb)
The wind rose shows the direction, speed, and frequency of winds at each community station when odour observations were submitted, between January 2022 and December 2022. The triangles indicate the direction the wind is coming from, the colours within the triangles show the different speeds of the wind, and the size of the bars within the triangles shows the number of hours the wind was travelling from.
Wind Speed (km/hour)
Asphalt
Fecal
Fuel
Sulphur
Data in the following section is presented using histograms. Concentration ranges are shown in correlation to the number of odour observations that were submitted.
The above histograms show the distribution of different air quality concentrations and meteorological parameters. This is not representative of the whole year; it only shows the conditions when odour observations were submitted.
The pollution rose shows the pollutant concentration and wind direction at each community station when odour observations were submitted, between January 2022 and December 2022. The triangles indicate the direction the wind is coming from, the colours within the triangles show the different concentrations of the pollutant, and the size of the bars within the triangles shows the number of hours the pollutant concentration was associated with that wind direction.
NMHC (ppm)
The pollution rose shows the pollutant concentration and wind direction at each community station when odour observations were submitted, between January 2022 and December 2022. The triangles indicate the direction the wind is coming from, the colours within the triangles show the different concentrations of the pollutant, and the size of the bars within the triangles shows the number of hours the pollutant concentration was associated with that wind direction.
SO2 (ppb)
The pollution rose shows the pollutant concentration and wind direction at each community station when odour observations were submitted, between January 2022 and December 2022. The triangles indicate the direction the wind is coming from, the colours within the triangles show the different concentrations of the pollutant, and the size of the bars within the triangles shows the number of hours the pollutant concentration was associated with that wind direction.
TRS (ppb)
The pollution rose shows the pollutant concentration and wind direction at each community station when odour observations were submitted, between January 2022 and December 2022. The triangles indicate the direction the wind is coming from, the colours within the triangles show the different concentrations of the pollutant, and the size of the bars within the triangles shows the number of hours the pollutant concentration was associated with that wind direction.
H2S (ppb)
The wind rose shows the direction, speed, and frequency of winds at each community station when odour observations were submitted, between January 2022 and December 2022. The triangles indicate the direction the wind is coming from, the colours within the triangles show the different speeds of the wind, and the size of the bars within the triangles shows the number of hours the wind was travelling from.
Wind Speed (km/hour)
Ammonia
Asphalt
Fecal
Fuel
Smoke
Sulphur
Other
Data in the following section is presented using histograms. Concentration ranges are shown in correlation to the number of odour observations that were submitted.
The above histograms show the distribution of different air quality concentrations and meteorological parameters. This is not representative of the whole year; it only shows the conditions when odour observations were submitted.
The pollution rose shows the pollutant concentration and wind direction at each community station when odour observations were submitted, between January 2022 and December 2022. The triangles indicate the direction the wind is coming from, the colours within the triangles show the different concentrations of the pollutant, and the size of the bars within the triangles shows the number of hours the pollutant concentration was associated with that wind direction.
NMHC (ppm)
The pollution rose shows the pollutant concentration and wind direction at each community station when odour observations were submitted, between January 2022 and December 2022. The triangles indicate the direction the wind is coming from, the colours within the triangles show the different concentrations of the pollutant, and the size of the bars within the triangles shows the number of hours the pollutant concentration was associated with that wind direction.
SO2 (ppb)
The pollution rose shows the pollutant concentration and wind direction at each community station when odour observations were submitted, between January 2022 and December 2022. The triangles indicate the direction the wind is coming from, the colours within the triangles show the different concentrations of the pollutant, and the size of the bars within the triangles shows the number of hours the pollutant concentration was associated with that wind direction.
TRS (ppb)
The wind rose shows the direction, speed, and frequency of winds at each community station when odour observations were submitted, between January 2022 and December 2022. The triangles indicate the direction the wind is coming from, the colours within the triangles show the different speeds of the wind, and the size of the bars within the triangles shows the number of hours the wind was travelling from.
Wind Speed (km/hour)
Ammonia
Asphalt
Fuel
Smoke
Sulphur
Other
Data in the following section is presented using histograms. Concentration ranges are shown in correlation to the number of odour observations that were submitted.
The above histograms show the distribution of different air quality concentrations and meteorological parameters. This is not representative of the whole year; it only shows the conditions when odour observations were submitted.
The pollution rose shows the pollutant concentration and wind direction at each community station when odour observations were submitted, between January 2022 and December 2022. The triangles indicate the direction the wind is coming from, the colours within the triangles show the different concentrations of the pollutant, and the size of the bars within the triangles shows the number of hours the pollutant concentration was associated with that wind direction.
SO2 (ppb)
The pollution rose shows the pollutant concentration and wind direction at each community station when odour observations were submitted, between January 2022 and December 2022. The triangles indicate the direction the wind is coming from, the colours within the triangles show the different concentrations of the pollutant, and the size of the bars within the triangles shows the number of hours the pollutant concentration was associated with that wind direction.
H2S (ppb)
The wind rose shows the direction, speed, and frequency of winds at each community station when odour observations were submitted, between January 2022 and December 2022. The triangles indicate the direction the wind is coming from, the colours within the triangles show the different speeds of the wind, and the size of the bars within the triangles shows the number of hours the wind was travelling from.
Wind Speed (km/hour)
Total odour observations observed
117Total
unique users
Odours with a long duration
Most prevalent odour type Asphalt
Second most prevalent odour type Ammonia
The following graphs provide a summary of all odour event parameters submitted to the COMP app by users in 2022.

Air Monitoring Stations
These are the locations of the WBEA Air Monitoring Stations. Select a pin and then click on the station to be redirected to the station page on the WBEA’s website.

Total odour observations
Sept 2017 to Dec 2022
144683%
of odour observations were long (>60 min) or intermediate (15-60 min) in duration, since 2017.
Highest number of observations occuring
in May through September
The Community Odour Monitoring Program is still going on. To participate and provide information on the odours you experience in the Regional Municipality of Wood Buffalo:
The information collected is anonymous and will be used for research purposes only.
The Wood Buffalo Environmental Association is a partner of Alberta Environment and Parks.
This work was funded under the Oil Sands Monitoring Program and is a contribution to the Program but does not necessarily reflect the position of the Program.