2021 COMP
Annual Report
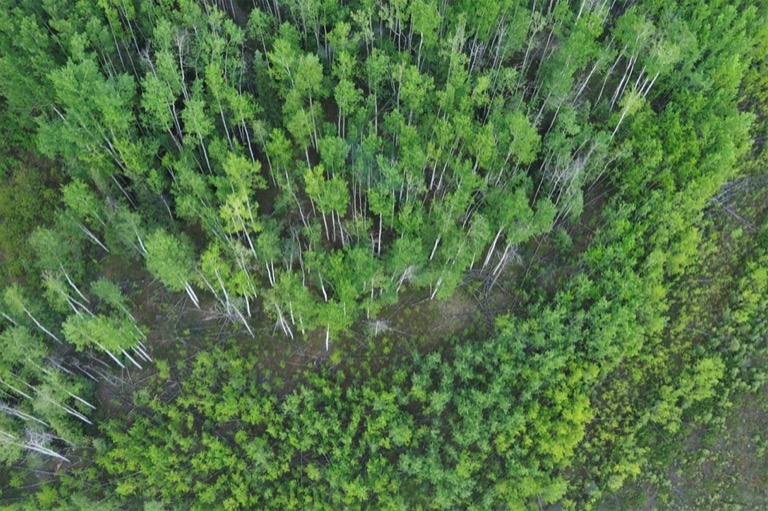
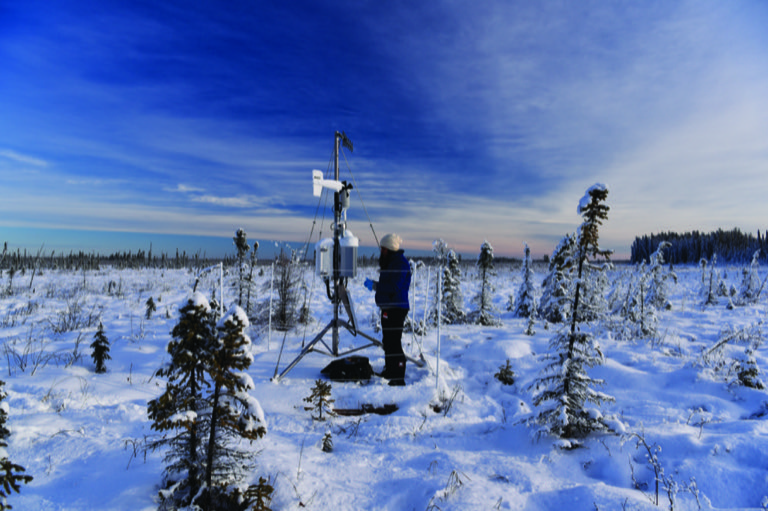
The Wood Buffalo Environmental Association (WBEA) monitors the air quality in the Regional Municipality of Wood Buffalo (RMWB) 24 hours a day, 365 days a year, through a network of 29 ambient air monitoring stations. Each station continuously measures concentrations of pollutants, along with meteorological parameters such as wind speed and direction, temperature, humidity, and atmospheric pressure.
The WBEA was repeatedly approached by community partners about the odour events they had experienced. Currently, analyzers can measure the concentration of specific pollutants or groups of pollutants but cannot detect the presence or intensity of an odour.
The Community Odour Monitoring Program (COMP) App was developed by the WBEA to enable individuals to submit information about the odours they experience. The App allows the WBEA to connect that information to the ambient air data collected at WBEA air monitoring stations.

Pollution is emitted into the air from a variety of sources
The pollution may cause odours - anyone who experiences an odour in the RMWB can submit their observations via the WBEA’s COMP app
Users can learn about odours and view all observations submitted at comp.wbea.org
The WBEA uses the app data to compare with the ambient air data collected at each station.
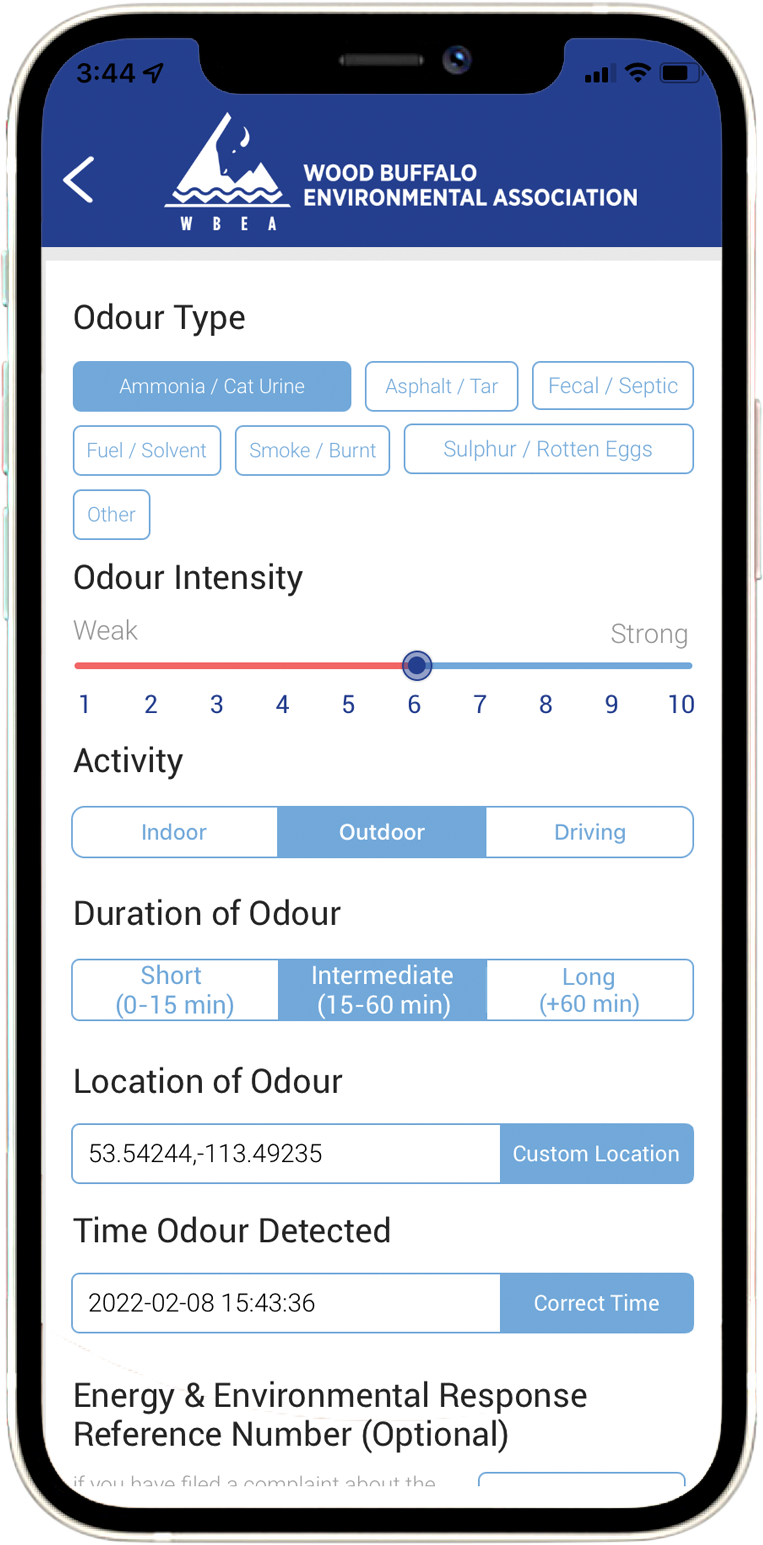
Once an odour is at a concentration high enough to be detected by an individual, the type of odour can be described. The odour type is completely subjective based on the person, and within the COMP App there are currently seven options: Ammonia/Cat Urine, Asphalt/Tar, Fecal/Septic, Fuel/Solvent, Smoke/Burnt, Sulphur/Rotten Eggs, and Other. Users are to select the odour type that best describes, to them, the odour they are experiencing.
The intensity of an odour is the perceived strength of the odour that is being experienced by the individual and is not necessarily related to its concentration. For example, a particularly pungent odour at a low concentration may be perceived to be more intense than a less pungent substance at a higher concentration. The intensity may also depend on the individual’s sensitivity to odours.
Activity is included so that users can provide information about what they are doing when they encounter the odour; they can indicate whether they are indoors, outdoors, or driving.
Duration of odour is the length of time the user experiences the odour. This is to provide context about whether someone had a brief encounter with an odour, or experienced a long-lasting, persistent smell.
It is necessary to collect the position where the user experienced the odour so that the WBEA can compare the data to the closest ambient air monitoring station. It is also used to compare multiple observations to each other if they are submitted from the same area.
To compare odours experienced by users to the data the WBEA collects at their ambient air monitoring stations, the WBEA needs to know the date and time the user encountered the odour.
If an odour is particularly strong and a user wants to file a report with the Alberta Government, they can call their 24-hour Energy & Environmental Response line, whose number is listed on the main page of the App. When a user files a report, they will be provided with a Reference Number. The user can enter that Reference Number into the App, to show a report was filed. This is an optional field within the COMP App.

Odour Event Days occur when multiple odour observations are submitted through the app for the same day. The WBEA compares the submitted odour observations to ambient air data collected at community air monitoring stations.
Due to population variances across the communities in the RMWB, criteria for determining an odour event day differs by community. In Fort McMurray, Odour Event Days occur when four or more unique user observations are submitted on the same day. An odour event day in Fort McKay occurs when two or more unique user observations are submitted on the same day, while an odour event for Anzac, Janvier, Conklin and Fort Chipewyan occurs when there was one odour observation.
In 2021, a total of 17 days met these criteria
Since counting Odour Event Days through the OMP Program relies on individuals reporting through the App, the Odour Event Days reported here likely do not represent the actual number of odour event days in each community and may under represent odours experienced by the public.
On July 12, four observations were submitted by four different users in Fort McMurray. Two observations were from Timberlea area and two from downtown area. Two observations described the odour type as ‘Sulphur’ and two as ‘Smoke’. The observations were submitted between 07:55 and 11:20 with three users reporting being outdoors at the time and one driving.
The air monitoring stations (AMS) in Fort McMurray are Patricia McInnes AMS, located in Timberlea and Athabasca Valley AMS, located downtown near Macdonald Island. TRS and NMHC levels were low at both stations. SO2 concentrations were low at the time of the observations but did increase to over 2 ppb at both stations later in the day. Winds had been light and from the southwest but at the time of the latter observations, the wind speed increased, and wind direction changed to north and north-northwest.
The change in wind direction may have transported an industrial plume containing other odour-causing compounds – compounds other than TRS or NMHC - across the city.
On August 15, two observations were submitted by two different users in Fort McKay. The observations were submitted between 21:00 and 21:30 with both observations indicating a ‘Fuel’ odour.
Fort McKay has two ambient air monitoring stations (AMS), Bertha Ganter-Fort McKay AMS and Waskōw Ochi Pimâtisiwin AMS. SO2, TRS and NMHC concentrations at Bertha Ganter-Fort McKay AMS peaked at the time of the observations with SO2 concentrations over 6 ppb and TRS concentrations of 1.2 ppb. SO2 and H2S concentrations at Waskōw Ochi Pimâtisiwin AMS also peaked at 21:00. Winds were light and persisted from south-southeast.
Elevated SO2, NMHC, TRS, and H2S concentrations coincided with the time of odour observation submission and were likely an indicator of an industrial plume. The observations coincided with wind direction from the south and south-southeast and light wind speed.
On August 31, eleven observations were submitted by four different users in Fort McMurray. Observations were submitted from multiple locations in Fort McMurray with four observations reporting the odour type as ‘Ammonia’, three as ‘Fecal’, one as ‘Sulphur’ and one as ‘Asphalt’. Observations were submitted at various times of the day spanning the period 05:00 to 21:00.
The air monitoring stations (AMS) in Fort McMurray are Patricia McInnes AMS, located in Timberlea and Athabasca Valley AMS, located downtown near Macdonald Island. TRS and SO2 levels were elevated at both stations during the day with an hourly TRS concentration of 5.5 ppb measured at Athabasca Valley at 21:00. This was the highest hourly TRS concentration measured at the station in 2021. Winds speeds were moderate and from the north-northwest for most of the day.
Elevated SO2 and TRS concentrations coincided with times of odour observations and were likely an indicator of an industrial plume(s). The observations coincided with wind direction from the north
On September 19, four observations were submitted by four different users in Fort McMurray. All four observations reported the odour type as ‘Ammonia’. Observations were reported from 01:00 to 17:00.
The air monitoring stations (AMS) in Fort McMurray are Patricia McInnes AMS, located in Timberlea and Athabasca Valley AMS, located downtown near Macdonald Island. Concentrations of SO2, TRS and NMHC were generally low at both stations during the period of observations with an increase in SO2 at Patricia McInnes at the time of the 06:00 observation and an increase in SO2 at Athabasca Valley at the time of the 16:00 observation. Wind speeds were light with wind direction from the west-northwest west and north-northwest.
The observations spanned a large period with varying wind directions. The observations were consistent in odour type, but the air quality parameters measured at the stations were generally not elevated. No conclusion on the origin of odour-causing compounds.
On September 28, twenty-eight observations were submitted by twenty different users in Fort McMurray. This was the highest number of odours reported in one day for 2021. The observations were submitted from numerous locations in Fort McMurray, with twenty-four reporting the odour as 'Ammonia', one as 'Asphalt', one as ‘Fecal’, one as ‘Fuel’ and one as 'Other'. The observations were made between 07:00 and 19:00, with sixteen submitted between 07:00 and 09:00 and eleven between 16:00 and 19:00
The air monitoring stations (AMS) in Fort McMurray are Patricia McInnes AMS, located in Timberlea and Athabasca Valley AMS, located downtown near Macdonald Island. Both stations recorded an increase in SO2 and TRS coinciding with the morning observations with winds light from the north. NMHC concentrations also increased at Athabasca Valley AMS. During the afternoon at Patricia McInnes AMS, SO2 concentrations increased from 2 ppb at 15:00 to 22 ppb at 16:00. Wind speed was light with variable wind direction changing from north-northwest to west.
Elevated SO2 concentrations coincided with times of odour observations and were likely an indicator of an industrial plume(s) that could be carrying other odour-causing compounds. The observations coincided with wind direction from the north.
On October 5, five observations were submitted by five different users in Fort McMurray. Three observations reported the odour type as ‘Asphalt’, one as ‘Ammonia’, and one as ‘Other’. Observations were submitted between 11:00 and 13:00.
The air monitoring stations (AMS) in Fort McMurray are Patricia McInnes AMS, located in Timberlea and Athabasca Valley AMS, located downtown near Macdonald Island. TRS, SO2 and NMHC levels increased at both stations during the period of observations with TRS concentrations peaking at 1.2 ppb at Athabasca Valley at noon. Winds speeds were moderate and from the north and north-northwest.
Elevated SO2, TRS and NMHC concentrations coincided with times of odour observations and were likely an indicator of an industrial plume(s). The observations coincided with wind direction from the north.
On October 6, eleven observations were submitted by seven different users in Fort McMurray. Four observations reported the odour type as ‘Ammonia’, two as ‘Asphalt’, three as ‘Fuel’, and two as ‘Sulphur’. Observations were submitted between 08:00 and 18:00. Five observations were submitted between 08:00 and 11:00 and six between 15:00 and 18:00.
The air monitoring stations (AMS) in Fort McMurray are Patricia McInnes AMS, located in Timberlea and Athabasca Valley AMS, located downtown near Macdonald Island. TRS and SO2 levels increased at both stations for both clusters of observations with the highest SO2 values (11 and 13 ppb) measured at both stations at 16:00. NMHC concentrations were elevated at Athabasca Valley from 05:00 to 11:00. Winds speeds were light and from the north and north-northwest.
Elevated SO2, TRS and NMHC concentrations coincided with times of odour observations and were likely an indicator of an industrial plume(s). The observations coincided with wind direction from the north.
On October 10, five observations were submitted by four different users in Fort McMurray. Four observations reported the odour type as ‘Ammonia’ and one as ‘Asphalt’. Observations were submitted between 11:00 and 21:00 with three observations recorded at 15:00.
The air monitoring stations (AMS) in Fort McMurray are Patricia McInnes AMS, located in Timberlea and Athabasca Valley AMS, located downtown near Macdonald Island. TRS and SO2 levels increased sharply at both stations at 15:00 with SO2 concentrations reaching 6 ppb at both stations and TRS levels reaching 1.3 ppb at Athabasca Valley AMS. Winds speeds were moderate and from the north-northwest during this period. The earlier and later observations on this date were not associated with an increase in the concentration of the air quality parameters.
Elevated SO2, TRS, and NMHC concentrations coincided with times of the afternoon odour observations and were likely an indicator of an industrial plume(s). The observations coincided with wind direction from the north.
On October 11, twenty-four observations were submitted by fifteen different users in Fort McMurray. This was the second-highest number of odours reported in one day for 2021. The observations were submitted from numerous locations in Fort McMurray, with nineteen reporting the odour as 'Ammonia', two as 'Asphalt' and one as 'Other'. The observations were made between 09:00 and 21:00 with two or three observations per hour for most of the period.
The air monitoring stations (AMS) in Fort McMurray are Patricia McInnes AMS, located in Timberlea and Athabasca Valley AMS, located downtown near Macdonald Island. Concentrations of TRS and NMHC were low at both stations for the day but SO2 concentrations were very high at both stations for much of the day. During the afternoon at the Patricia McInnes AMS, SO2 concentrations peaked at 22 ppb at 18:00, and Athabasca Valley SO2 concentrations peaked at 18 ppb at 17:00. Winds speeds were moderate and persisted from the north and north-northwest.
Elevated SO2 concentrations coincided with times of odour observations and were likely an indicator of an industrial plume(s) that could be carrying odour-causing compounds. The observations coincided with wind direction from the north.
On October 12, three observations were submitted by two different users in Fort McKay. Two observations were submitted at 06:00 and one at 14:00 with all observations indicating an ‘Ammonia’ odour.
Fort McKay has two ambient air monitoring stations (AMS), Bertha Ganter-Fort McKay AMS and Waskōw Ochi Pimâtisiwin AMS. The 06:00 observations coincided with an increase in SO2 and TRS concentrations at Bertha Ganter AMS and an increase in SO2 and H2S concentrations at Waskōw Ochi Pimâtisiwin AMS. The same occurred for the 14:00 observations but SO2 concentrations were much higher in the afternoon. Winds were light in the morning increasing to moderate/strong in the afternoon and persisted from the south.
Elevated SO2, TRS, and H2S concentrations coincided with the time of odour observation submission and were likely an indicator of an industrial plume(s). The observations coincided with wind direction from the south.
On October 17, twenty-one observations were submitted by sixteen different users in Fort McMurray. This was the third-highest number of odours reported in one day for 2021. The observations were submitted from numerous locations in Fort McMurray, with seventeen reporting the odour as 'Ammonia', one as 'Asphalt', one as ‘Fuel’, one as ‘Sulphur’ and one as 'Other'. The observations were made between 07:00 and 19:00 with fourteen between 07:00 and 08:00.
The air monitoring stations (AMS) in Fort McMurray are Patricia McInnes AMS, located in Timberlea and Athabasca Valley AMS, located downtown near Macdonald Island. At Patricia McInnes AMS, NMHC concentrations were low throughout the day but SO2 and TRS concentrations increased from 06:00 onwards with an SO2 peak of 18 ppb at 11:00. At Athabasca Valley AMS, SO2 concentrations peaked at 7 ppb at 14:00. TRS and NMHC at the Athabasca Valley AMS peaked at 07:00-08:00. Winds speeds were light to moderate and persisted from the northwest and north-northwest.
Elevated SO2 and TRS concentrations coincided with times of odour observations and were likely an indicator of an industrial plume(s). The observations coincided with wind direction from the north.
On November 4, five observations were submitted by five different users in Fort McMurray. Two observations reported the odour type as ‘Ammonia’, two as ‘Asphalt’ and one as ‘Fecal’. Observations were submitted between 19:00 and 24:00.
The air monitoring stations (AMS) in Fort McMurray are Patricia McInnes AMS, located in Timberlea and Athabasca Valley AMS, located downtown near Macdonald Island. TRS, SO2 and NMHC levels all increased rapidly at both stations during the observation period with TRS concentrations exceeding 1 ppb at both stations. Winds speeds were moderate and from the north and north-northwest.
Elevated SO2, TRS and NMHC concentrations coincided with times of the odour observations and were likely an indicator of an industrial plume(s). The observations coincided with wind direction from the north.
On November 5, six observations were submitted by six different users in Fort McMurray. Three observations reported the odour type as ‘Ammonia’, two as ‘Sulphur’ and one as ‘Fuel’. Observations were submitted between 00:00 and 03:00.
The air monitoring stations (AMS) in Fort McMurray are Patricia McInnes AMS, located in Timberlea and Athabasca Valley AMS, located downtown near Macdonald Island. TRS, SO2 and NMHC levels were elevated at both stations during the observation period with TRS concentrations exceeding 1 ppb at Athabasca Valley AMS and NMHC concentrations exceeding 0.8 ppm. Winds speeds were moderate and from the north-northwest.
Elevated SO2, TRS and NMHC concentrations coincided with times of the odour observations and were likely an indicator of an industrial plume(s). The observations coincided with wind direction from the north.
On November 5, one observation was submitted by one user in Anzac approximately 6 km from the Anzac air monitoring station (AMS). The observation was submitted at 09:50 and reported the odour type as ‘Asphalt’.
Wind speed was light and from the north-northwest for the hour of the observation. SO2, TRS and NMHC levels were all low at the Anzac monitoring station but SO2 and TRS concentrations did increase at the time of the observation.
The observation was likely an indicator of an industrial plume from the north.
On December 1, twelve observations were submitted by ten different users in Fort McMurray. Observations were submitted between 07:00 and 17:00 with ten between 07:00 and 11:00. Six observations reported the odour type as ‘Ammonia’, three as ‘Asphalt’, two as ‘Fuel’ and one as ‘Sulphur’.
The air monitoring stations (AMS) in Fort McMurray are Patricia McInnes AMS, located in Timberlea and Athabasca Valley AMS, located downtown near Macdonald Island. TRS and NMHC concentrations were low at both stations throughout the day. Hourly SO2 concentrations at Patricia McInnes AMS were elevated for much of the day and reached a peak of 14 ppb at 10:00. Wind direction was from the north or north-northwest with moderate wind speeds.
Elevated levels of SO2 did coincide with observations of odours and were likely an indicator of an industrial plume that also could be carrying odour-causing compounds. The observations coincided with wind direction from the north.
On December 7, two observations were submitted by one user in Anzac approximately 2 km from the Anzac community air monitoring station (AMS). The observations were submitted at 12:15 and 12:40 and reported the odour type as ‘Ammonia’.
Wind speed was light and from the north-northwest for the hour of the observation. TRS and NMHC levels were low at the Anzac AMS but SO2 concentrations did increase at the time of the observation and remained higher through much of the day. Winds were light and from the southeast.
The observation was likely an indicator of an industrial plume from the southeast.
On December 12, six observations were submitted by five different users in Fort McMurray. Observations were submitted between 09:30 and 11:00. Two observations reported the odour type as ‘Sulphur’, one as ‘Asphalt’, one as ‘Ammonia’, one as ‘Fuel’ and one as ‘Sulphur’.
The air monitoring stations (AMS) in Fort McMurray are Patricia McInnes AMS, located in Timberlea and Athabasca Valley AMS, located downtown near Macdonald Island. At the time of the observations SO2, TRS and NMHC concentrations were low at both stations but hourly SO2 concentrations at Patricia McInnes AMS rose from near zero at 8:00 to 8 ppb at 15:00. TRS concentrations also increased. An increase in SO2 and TRS was seen at the Athabasca Valley AMS also later in the day. Wind speeds were light and variable ranging from west to north-northeast to north-northwest.
An increase in SO2 did coincide with observations of odours and was likely an indicator of an industrial plume that also could be carrying odour-causing compounds.
Below is a breakdown of all the odour observations received from the different regions of the RMWB in 2021. If a community is missing, it is because no odour observations were submitted from that location.
Ammonia
Asphalt
Fuel
Smoke
Sulphur
The above histograms show the distribution of different air quality concentrations and meteorological parameters. This is not representative of the whole year; it only shows the conditions when odour observations were submitted.
The pollution rose shows the pollutant concentration and wind direction at each community station when odour observations were submitted, between January 2020 and December 2020. The triangles indicate the direction the wind is coming from, the colours within the triangles show the different concentrations of the pollutant, and the size of the bars within the triangles shows the percentage of time the pollutant concentration was associated with that wind direction.
NMHC (ppm)
The pollution rose shows the pollutant concentration and wind direction at each community station when odour observations were submitted, between January 2020 and December 2020. The triangles indicate the direction the wind is coming from, the colours within the triangles show the different concentrations of the pollutant, and the size of the bars within the triangles shows the percentage of time the pollutant concentration was associated with that wind direction.
SO2 (ppb)
The pollution rose shows the pollutant concentration and wind direction at each community station when odour observations were submitted, between January 2020 and December 2020. The triangles indicate the direction the wind is coming from, the colours within the triangles show the different concentrations of the pollutant, and the size of the bars within the triangles shows the percentage of time the pollutant concentration was associated with that wind direction.
TRS (ppb)
The wind rose shows the direction, speed, and frequency of winds at each community station when odour observations were submitted, between January 2020 and December 2020. The triangles indicate the direction the wind is coming from, the colours within the triangles show the different speeds of the wind, and the size of the bars within the triangles shows the percentage of time the wind was travelling from that direction and that speed.
Wind Speed (km/hour)
Calms 0.00%
Ammonia
Fuel
The above histograms show the distribution of different air quality concentrations and meteorological parameters. This is not representative of the whole year; it only shows the conditions when odour observations were submitted.
The pollution rose shows the pollutant concentration and wind direction at each community station when odour observations were submitted, between January 2020 and December 2020. The triangles indicate the direction the wind is coming from, the colours within the triangles show the different concentrations of the pollutant, and the size of the bars within the triangles shows the percentage of time the pollutant concentration was associated with that wind direction.
NMHC (ppm)
The pollution rose shows the pollutant concentration and wind direction at each community station when odour observations were submitted, between January 2020 and December 2020. The triangles indicate the direction the wind is coming from, the colours within the triangles show the different concentrations of the pollutant, and the size of the bars within the triangles shows the percentage of time the pollutant concentration was associated with that wind direction.
SO2 (ppb)
The pollution rose shows the pollutant concentration and wind direction at each community station when odour observations were submitted, between January 2020 and December 2020. The triangles indicate the direction the wind is coming from, the colours within the triangles show the different concentrations of the pollutant, and the size of the bars within the triangles shows the percentage of time the pollutant concentration was associated with that wind direction.
TRS (ppb)
The wind rose shows the direction, speed, and frequency of winds at each community station when odour observations were submitted, between January 2020 and December 2020. The triangles indicate the direction the wind is coming from, the colours within the triangles show the different speeds of the wind, and the size of the bars within the triangles shows the percentage of time the wind was travelling from that direction and that speed.
Wind Speed (km/hour)
Calms 0.00%
Ammonia
Asphalt
Fecal
Fuel
Smoke
Sulphur
Other
The above histograms show the distribution of different air quality concentrations and meteorological parameters. This is not representative of the whole year; it only shows the conditions when odour observations were submitted.
The pollution rose shows the pollutant concentration and wind direction at each community station when odour observations were submitted, between January 2020 and December 2020. The triangles indicate the direction the wind is coming from, the colours within the triangles show the different concentrations of the pollutant, and the size of the bars within the triangles shows the percentage of time the pollutant concentration was associated with that wind direction.
NMHC (ppm)
The pollution rose shows the pollutant concentration and wind direction at each community station when odour observations were submitted, between January 2020 and December 2020. The triangles indicate the direction the wind is coming from, the colours within the triangles show the different concentrations of the pollutant, and the size of the bars within the triangles shows the percentage of time the pollutant concentration was associated with that wind direction.
SO2 (ppb)
The pollution rose shows the pollutant concentration and wind direction at each community station when odour observations were submitted, between January 2020 and December 2020. The triangles indicate the direction the wind is coming from, the colours within the triangles show the different concentrations of the pollutant, and the size of the bars within the triangles shows the percentage of time the pollutant concentration was associated with that wind direction.
TRS (ppb)
The wind rose shows the direction, speed, and frequency of winds at each community station when odour observations were submitted, between January 2020 and December 2020. The triangles indicate the direction the wind is coming from, the colours within the triangles show the different speeds of the wind, and the size of the bars within the triangles shows the percentage of time the wind was travelling from that direction and that speed.
Wind Speed (km/hour)
Calms 0.00%
Ammonia
Asphalt
Fuel
Sulphur
Other
The above histograms show the distribution of different air quality concentrations and meteorological parameters. This is not representative of the whole year; it only shows the conditions when odour observations were submitted.
The pollution rose shows the pollutant concentration and wind direction at each community station when odour observations were submitted, between January 2020 and December 2020. The triangles indicate the direction the wind is coming from, the colours within the triangles show the different concentrations of the pollutant, and the size of the bars within the triangles shows the percentage of time the pollutant concentration was associated with that wind direction.
NMHC (ppm)
The pollution rose shows the pollutant concentration and wind direction at each community station when odour observations were submitted, between January 2020 and December 2020. The triangles indicate the direction the wind is coming from, the colours within the triangles show the different concentrations of the pollutant, and the size of the bars within the triangles shows the percentage of time the pollutant concentration was associated with that wind direction.
SO2 (ppb)
The pollution rose shows the pollutant concentration and wind direction at each community station when odour observations were submitted, between January 2020 and December 2020. The triangles indicate the direction the wind is coming from, the colours within the triangles show the different concentrations of the pollutant, and the size of the bars within the triangles shows the percentage of time the pollutant concentration was associated with that wind direction.
TRS (ppb)
The wind rose shows the direction, speed, and frequency of winds at each community station when odour observations were submitted, between January 2020 and December 2020. The triangles indicate the direction the wind is coming from, the colours within the triangles show the different speeds of the wind, and the size of the bars within the triangles shows the percentage of time the wind was travelling from that direction and that speed.
Wind Speed (km/hour)
Calms 0.00%
Total odour observations observed
304Total
unique users
Odours with a long duration
Most prevalent odour type Ammonia
Second most prevalent odour type Asphalt

These are the locations of the WBEA Air Monitoring Station. Select a pin and then click on the station to be redirected to the station page on the WBEA’s website.
Total odour observations
September 2017 to December 2021
132475%
of odour observations were long (>60 min) or intermediate (15-60 min) in duration, since 2017.
Highest number of observations occuring in May through September
2018 Asphalt/Tar
2019 Ammonia
2020 Ammonia
2021 Ammonia


The Community Odour Monitoring Program is still going on. To participate and provide information on the odours you experience in the Regional Municipality of Wood Buffalo:
The information collected is anonymous and will be used for research purposes only.
The Wood Buffalo Environmental Association is a partner of Alberta Environment and Parks.
This work was funded under the Oil Sands Monitoring Program and is a contribution to the Program but does not necessarily reflect the position of the Program.